GSEA with R
Objectives
- Form the inputs for Gene Set Enrichment Analysis (GSEA) in WebGestaltR from single-cell results.
- Use WebGestaltR to do a GSEA analysis.
- Understand how to interpret the results of GSEA analysis.
- Compare and contrast the results of two GSEA results.
Getting started
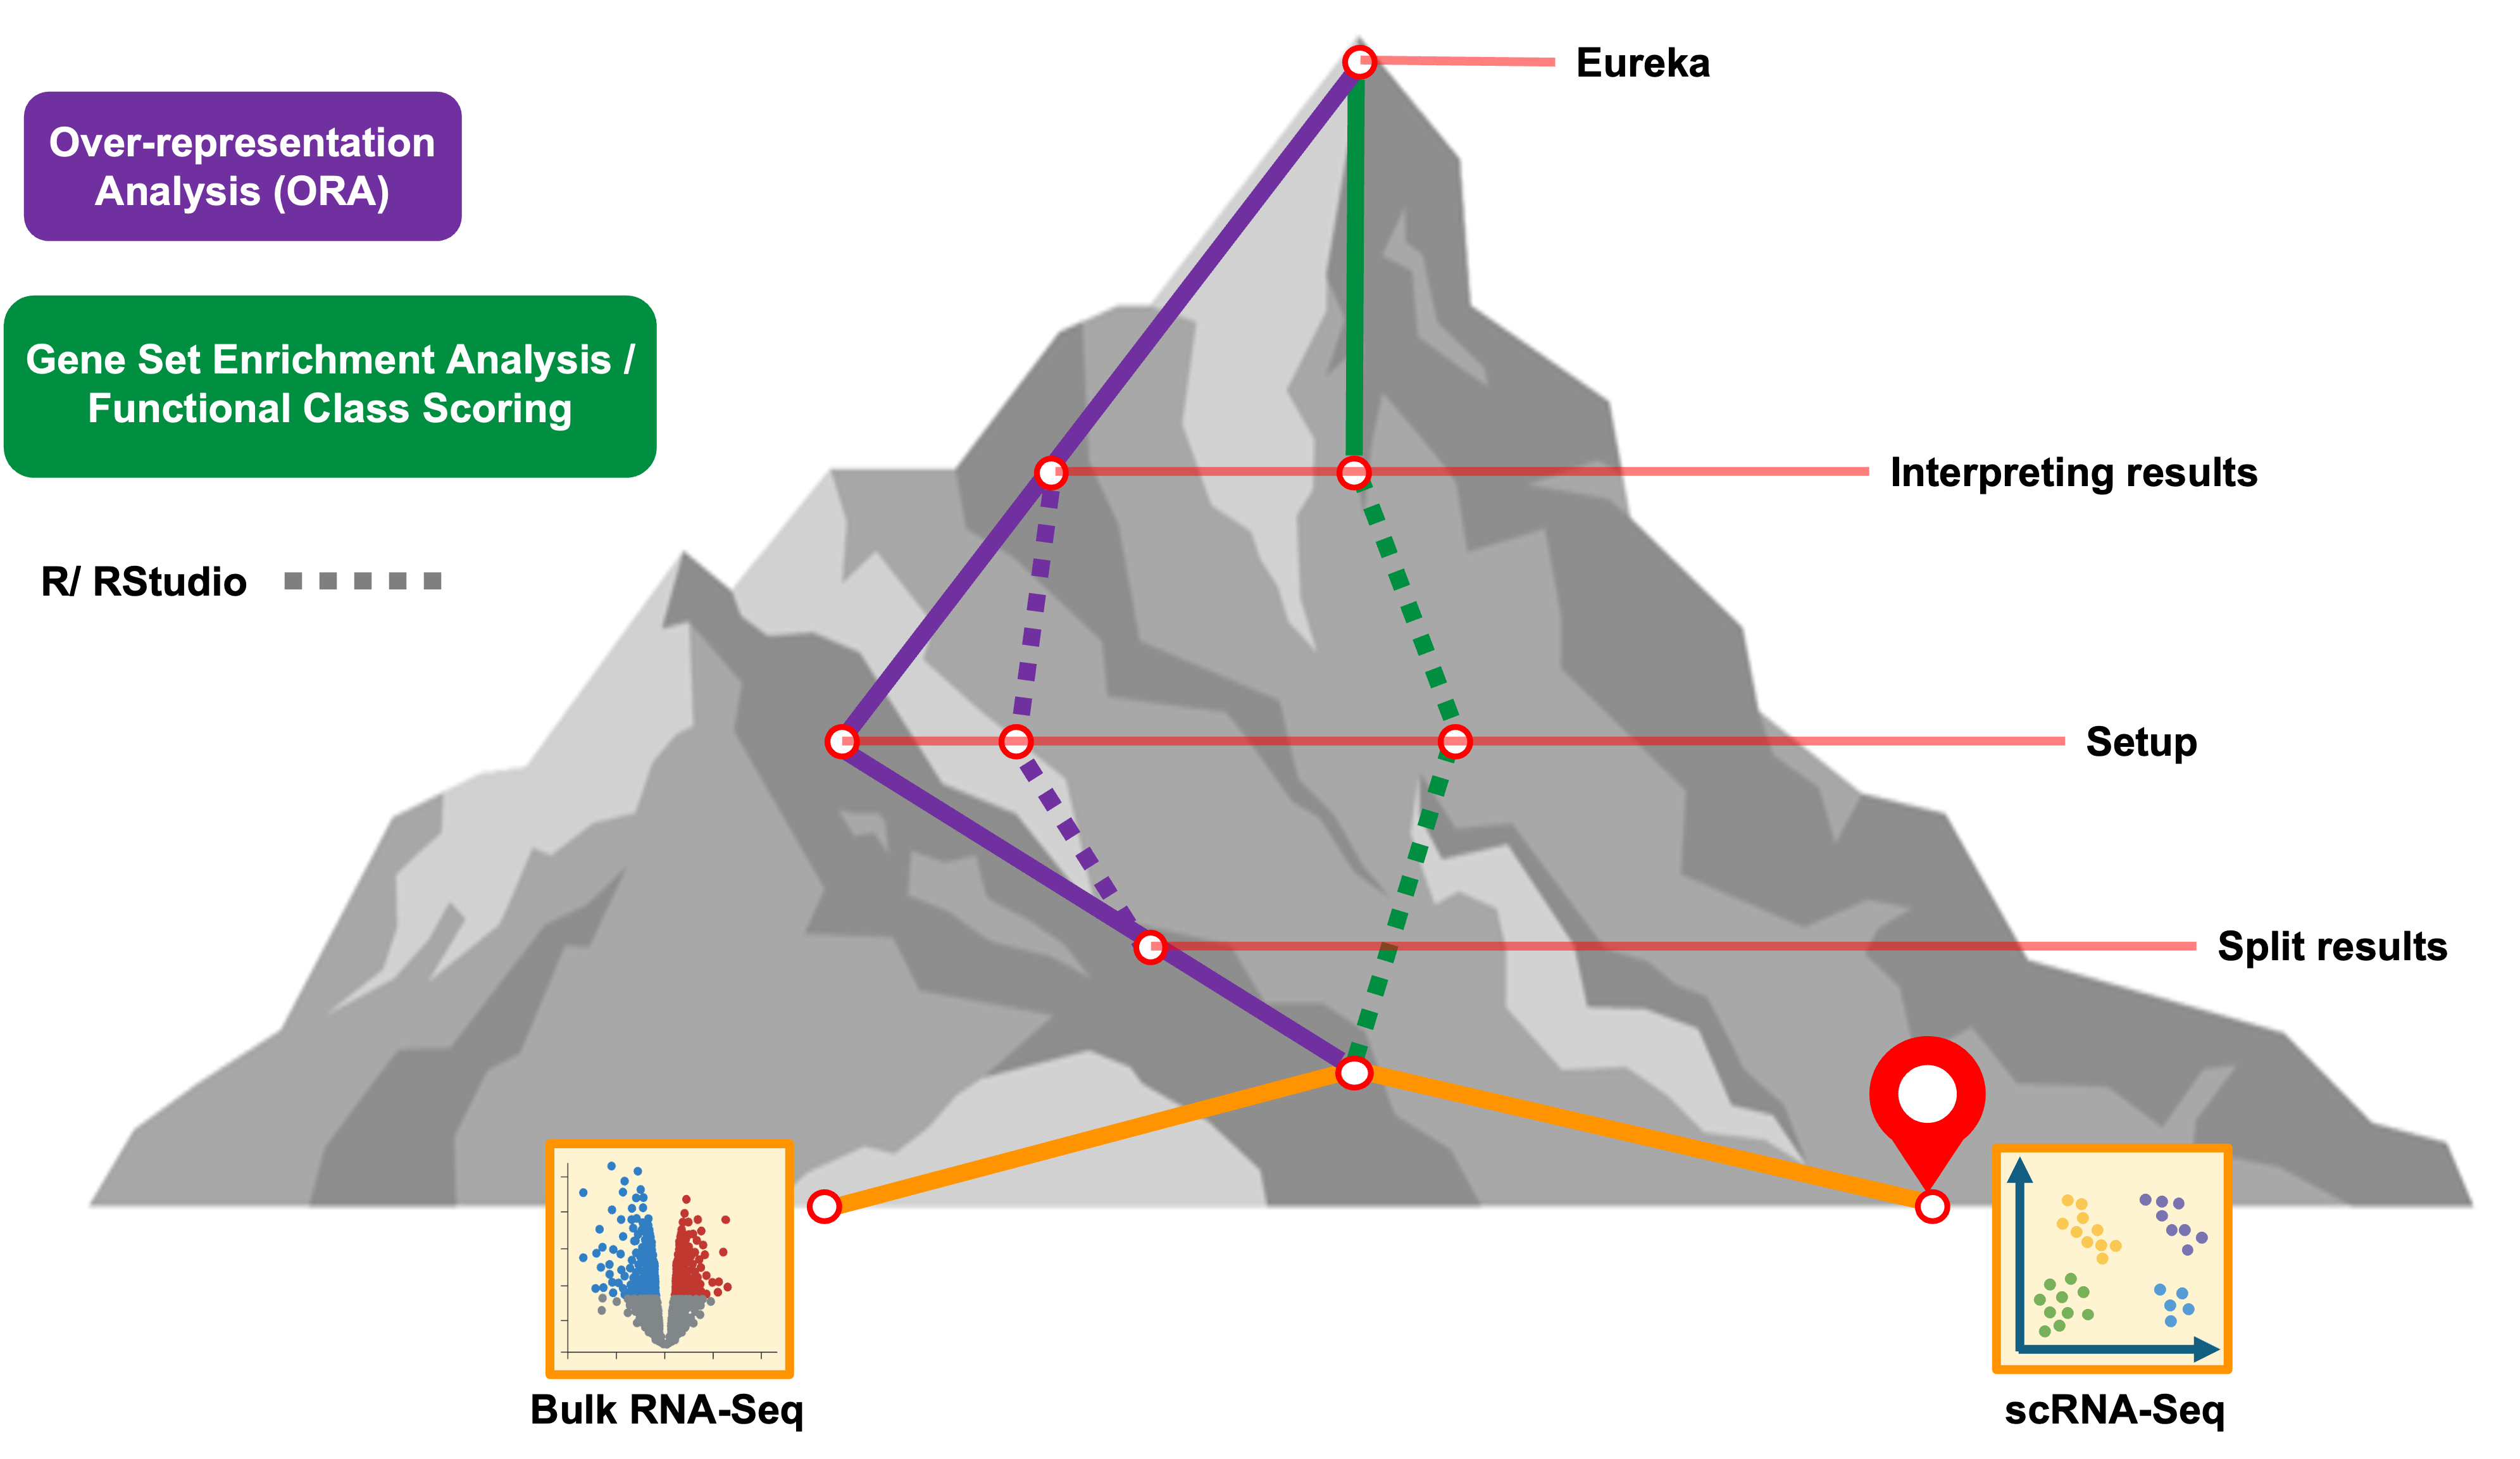
The setup for GSEA is similar to ORA, but there are two key differences:
- We do not require a threshold for significance, and
- We need to pass gene identifiers and the log fold-change for the gene from the differential expression test.
This gives the advantage of being able to use the differential expression results more fully, instead of limiting to DE genes.
Running GSEA using WebGestalt
First, we’ll re-load the libraries to ensure they are available.
# =========================================================================
# ORA with WebGestlatR
# =========================================================================

# -------------------------------------------------------------------------
# Load the libraries
library(WebGestaltR)
library(tidyverse)
We’ll then will take a second look at the documentation for the
WebGestaltR() function, and note the difference in input
between ORA and GSEA.
# -------------------------------------------------------------------------
# Look at the manual for the main function
?WebGestaltR
We note from the documentation that interestGene “should
be an R data.frame object containing two columns: the gene list and the
corresponding scores.” We also note that we will not
make use of the referenceGene argument.
Read in diffex results
We will demonstrate GSEA on a differential analysis from the single-cell RNA-seq experiment we explored in the Introduction to Single-cell Analysis (link). In particular, we’ll perform GSEA on the differential expression results in the pericyte cluster, starting with the results from the day 21 to day 7 comparison.
# -------------------------------------------------------------------------
# Load pseudo-bulk analysis for D21 vs D7 in pericyte cluster
isc_d21_v_d7 = read_csv('inputs/single_cell_de_results/de_pseudo_pericyte_D21_vs_D7.csv')
Rows: 23608 Columns: 6
── Column specification ──────────────────────────────────────────────────────────────────────────
Delimiter: ","
chr (1): gene
dbl (5): p_val, avg_log2FC, pct.1, pct.2, p_val_adj
ℹ Use `spec()` to retrieve the full column specification for this data.
ℹ Specify the column types or set `show_col_types = FALSE` to quiet this message.# -------------------------------------------------------------------------
# Preview the result
head(isc_d21_v_d7)# A tibble: 6 × 6
p_val avg_log2FC pct.1 pct.2 p_val_adj gene
<dbl> <dbl> <dbl> <dbl> <dbl> <chr>
1 3.86e-232 2.91 1 1 1.02e-227 Cilp2
2 5.63e-118 1.71 1 1 1.49e-113 Ltbp4
3 1.85e- 95 1.29 1 1 4.91e- 91 Cd55
4 2.60e- 87 1.64 1 1 6.88e- 83 Prss23
5 3.02e- 87 -1.59 1 1 8.00e- 83 Nav3
6 7.46e- 82 2.25 1 1 1.98e- 77 Gm42418Before preparing our data for GSEA, let’s also check how many genes were DE in the pseudobulk D21 vs D7 comparison using the same thresholds from the workshop.
# -------------------------------------------------------------------------
# Load pseudo-bulk analysis for D21 vs D7 in pericyte cluster
table(isc_d21_v_d7$p_val_adj < 0.05 & abs(isc_d21_v_d7$avg_log2FC) > 1.5)
FALSE  TRUE
23553    55
Extracting data for GSEA
The key columns to extract from our Day 21 vs Day 7 pericyte results
table, as per the documentation, are the gene and a column
of values to use to rank the genes. Before proceeding, it’s prudent to
check if there are missing values in the column we’ll use as our gene
identifier:
# -------------------------------------------------------------------------
# How many symbols are NA?
table(is.na(isc_d21_v_d7$gene))
FALSE
23608
For ranking, we can use the values from the avg_log2FC
column and create a table with just the gene and
avg_log2FC columns with the select() function
from dplyr:
# -------------------------------------------------------------------------
# Select gene and avg_log2FC columns
isc_d21_v_d7_gsea = isc_d21_v_d7 %>%
    dplyr::select(gene, avg_log2FC)

# -------------------------------------------------------------------------
# Preview the table
head(isc_d21_v_d7_gsea)
# A tibble: 6 × 2
gene avg_log2FC
<chr> <dbl>
1 Cilp2 2.91
2 Ltbp4 1.71
3 Cd55 1.29
4 Prss23 1.64
5 Nav3 -1.59
6 Gm42418 2.25Running GSEA
We will run GSEA on our single-cell results using the KEGG pathway knowledge base, which is per the website “a collection of manually drawn pathway maps representing our knowledge of the molecular interaction, reaction and relation networks” instead of gene ontology. This option allows us to
# -------------------------------------------------------------------------
# Run GSEA
isc_d21_v_d7_gsea_result = WebGestaltR(
    enrichMethod = 'GSEA',
    nThreads = 8,
    organism = 'mmusculus',
    enrichDatabase = c('pathway_KEGG'),
    interestGene = isc_d21_v_d7_gsea,
    interestGeneType = 'genesymbol',
    fdrThr = 0.1,
    outputDirectory = './results',
    projectName = 'D21_v_D7_GSEA_KEGG',
    cache = NULL)
Loading the functional categories...
Loading the ID list...Summarizing the uploaded ID list by GO Slim data...Performing the enrichment analysis...1000 permutations of score complete...Begin affinity propagation...
End affinity propagation...
Begin weighted set cover...
End weighted set cover...
Generate the final report...
Results can be found in the ./results/Project_D21_v_D7_GSEA_KEGG!# clean up session
gc() used (Mb) gc trigger (Mb) limit (Mb) max used (Mb)
Ncells 5027242 268.5 9336260 498.7 NA 9336260 498.7
Vcells 9999455 76.3 96646996 737.4 36864 136265526 1039.7One downside of GSEA is that it is more computationally demanding
than ORA. As the enrichment runs, we’ll see the reporting messages
1000 permutations of score complete this permutation was
introduced in the overview and is what generates a null distribution to
be able to determine “how surprising” the ranked overlaps are.
But what about our input? Why did we include the fold-change column?
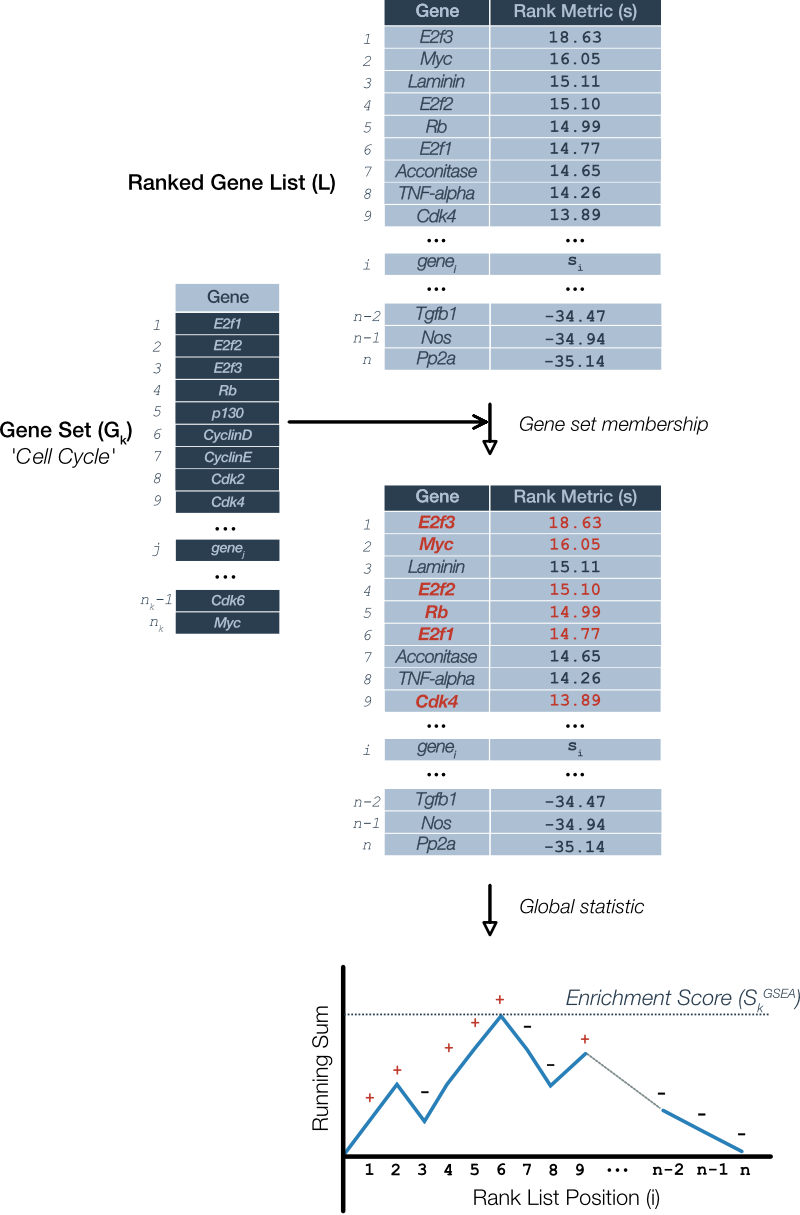
As mentioned, a ranking metric is needed to order the genes before they are compared to the functional gene sets to generate the enrichment score.
By using log fold-changes, we’re using the effect size of difference
between the experimental groups, the equivalent of
log2_Ratio_of_Classes in Broad’s
GSEA user guide describes the several ranking metrics available for
that tool. The advantage of using this as our ranking metric is that we
are using the biologically relevant difference while ignoring
significance level, which is important to rule out false positive but
can be impacted by within group variation and limited samples which
reduce the power to detect true positives.
However, you may also see a local ranking statistic that combines
both the direction of the effect size and the significance
(e.g. -log10({p value}) * sign({Fold Change})). The
advantage of this approach is that it incorporates the significance
level to protect against false positives - unlike fold-change alone -
while still using the direction of the effect size. The disadvantage of
using this combined metric is that the magnitude of the effect
size observed in the experiment is no longer part of the ranking.
For more context, this Pathways Common guide delves into the history and describes the GSEA algorithm in more detail.
The original version of GSEA is described in Mootha 2003 the values were chosen specifically such that the sum over all genes would be zero. An updated procedure using a ‘weighted’ version of such that the increments to the running sum are proportional to the rank metric for that gene is described in Subramanian et al 2005 and is the GSEA method used by WebGestaltR based on the package’s reference manual.
Results of GSEA
Once the tool is done running, we can review the results. As with the ORA results, the GSEA method outputs similar results tables, gene identifier mappings, and HTML reports to file but includes a table of the results in session.
# -------------------------------------------------------------------------
# View the first few results
head(isc_d21_v_d7_gsea_result)
geneSet description
1 mmu04512 ECM-receptor interaction
2 mmu03050 Proteasome
3 mmu03030 DNA replication
4 mmu03040 Spliceosome
5 mmu04657 IL-17 signaling pathway
6 mmu05012 Parkinson disease
link
1 http://www.kegg.jp/kegg-bin/show_pathway?mmu04512+12824+12845+12643+12841+21825+12840+21828+12839+12827+16779+20971+226519+12826+213119+12843+13138+16773+15530+12842+21827+15891+12834+16404+12833+11603+21826+319480+16398+12835+16776+81877+16419+14268+109700
2 http://www.kegg.jp/kegg-bin/show_pathway?mmu03050+19192+56436+16912+26440+66997+70247+19177+22123+20422+23996+19166+19179+19167+19184+19173+17463+19186+69077+26443+66413+23997+21762+19172+66537+103554+19171+26442+19181+19170+19188+19185+26445+26441+26446+26444+19175+16913
3 http://www.kegg.jp/kegg-bin/show_pathway?mmu03030+19076+18968+18974+106344+68275+18972+19075+69724+68209+19687+18971+59001+72151+69263+17217+381760+67153+17220+17215+14156+19718+17218+68240+19891+17216+17219+18538+16881+66979
4 http://www.kegg.jp/kegg-bin/show_pathway?mmu03040+57905+20637+54633+66492+68879+20639+331401+72654+53317+320632+212880+66810+67039+68183+56031+72047+66354+56194+20624+60365+20222+22185+76522+81898+101943+66441+20643+230596+68092+13204+67465+66055+76938+68479+229279+20826+20638+68988+17149+56009+68011+27756+20630+75062+69878+107701+101214+56215+319322+66585+20382+19655+23983+73666+231889+107686+67959+67996+27366+51810+108014+20641+78651+66094+15381+108121+28000+68981+67332+15387+66101+53607+53817+76936+19656+20462+67678+68816+66125+66373+110809+50783+20383+15382+225027+21681
5 http://www.kegg.jp/kegg-bin/show_pathway?mmu04657+14283+171095+17392+12370+71609+15519+15945+22033+14282+21929+16819+19225+22032+15568+18033+22027+16476+12367+110809+18035+12608+17395+20296+16176+20306+14825+20202+20201+20310+20311
6 http://www.kegg.jp/kegg-bin/show_pathway?mmu05012+66152+66043+22334+12857+67530+67003+18747+66108+12866+105675+230075+17995+66052+14678+66377+71679+68342+66416+66925+22187+228033+12868+75406+66694+66142+140499+22201+68202+13063+17993+104130+11957+22272+67942+66414+72900+225887+22333+67273+22195+66445+226646+22335+68349+67680+11950+66091+407785+595136+66046+70316+68375+12858+11946+66218+11949+12859+11783+68197+11947+22273+12861+12367+110323+66594+11739+28080+57320+66916+67264+11951+17992+11740
enrichmentScore normalizedEnrichmentScore pValue FDR size
1 0.7715357 2.085706 0 0.000000000 82
2 -0.8164866 -1.889504 0 0.000000000 46
3 -0.8525372 -1.896453 0 0.000000000 35
4 -0.7258237 -1.962938 0 0.000000000 128
5 -0.6895711 -1.775816 0 0.001455251 86
6 -0.6506295 -1.770073 0 0.001552268 125
plotPath leadingEdgeNum
1 ./Project_D21_v_D7_GSEA_KEGG_GSEA/mmu04512.png 34
2 ./Project_D21_v_D7_GSEA_KEGG_GSEA/mmu03050.png 37
3 ./Project_D21_v_D7_GSEA_KEGG_GSEA/mmu03030.png 29
4 ./Project_D21_v_D7_GSEA_KEGG_GSEA/mmu03040.png 86
5 ./Project_D21_v_D7_GSEA_KEGG_GSEA/mmu04657.png 30
6 ./Project_D21_v_D7_GSEA_KEGG_GSEA/mmu05012.png 73
leadingEdgeId
1 12824;12845;12643;12841;21825;12840;21828;12839;12827;16779;20971;226519;12826;213119;12843;13138;16773;15530;12842;21827;15891;12834;16404;12833;11603;21826;319480;16398;12835;16776;81877;16419;14268;109700
2 19192;56436;16912;26440;66997;70247;19177;22123;20422;23996;19166;19179;19167;19184;19173;17463;19186;69077;26443;66413;23997;21762;19172;66537;103554;19171;26442;19181;19170;19188;19185;26445;26441;26446;26444;19175;16913
3 19076;18968;18974;106344;68275;18972;19075;69724;68209;19687;18971;59001;72151;69263;17217;381760;67153;17220;17215;14156;19718;17218;68240;19891;17216;17219;18538;16881;66979
4 57905;20637;54633;66492;68879;20639;331401;72654;53317;320632;212880;66810;67039;68183;56031;72047;66354;56194;20624;60365;20222;22185;76522;81898;101943;66441;20643;230596;68092;13204;67465;66055;76938;68479;229279;20826;20638;68988;17149;56009;68011;27756;20630;75062;69878;107701;101214;56215;319322;66585;20382;19655;23983;73666;231889;107686;67959;67996;27366;51810;108014;20641;78651;66094;15381;108121;28000;68981;67332;15387;66101;53607;53817;76936;19656;20462;67678;68816;66125;66373;110809;50783;20383;15382;225027;21681
5 14283;171095;17392;12370;71609;15519;15945;22033;14282;21929;16819;19225;22032;15568;18033;22027;16476;12367;110809;18035;12608;17395;20296;16176;20306;14825;20202;20201;20310;20311
6 66152;66043;22334;12857;67530;67003;18747;66108;12866;105675;230075;17995;66052;14678;66377;71679;68342;66416;66925;22187;228033;12868;75406;66694;66142;140499;22201;68202;13063;17993;104130;11957;22272;67942;66414;72900;225887;22333;67273;22195;66445;226646;22335;68349;67680;11950;66091;407785;595136;66046;70316;68375;12858;11946;66218;11949;12859;11783;68197;11947;22273;12861;12367;110323;66594;11739;28080;57320;66916;67264;11951;17992;11740
userId
1 Agrn;Chad;Col1a1;Col1a2;Col2a1;Col4a1;Col4a2;Col6a1;Col6a2;Col6a3;Col9a1;Col9a2;Col9a3;Comp;Dag1;Fn1;Hspg2;Ibsp;Itga1;Itga10;Itga11;Itga2;Itga7;Itgb5;Lama2;Lama5;Lamb2;Lamc1;Sdc4;Thbs1;Thbs2;Thbs3;Thbs4;Tnxb
2 Adrm1;Pomp;Psma1;Psma2;Psma3;Psma4;Psma5;Psma6;Psma7;Psmb1;Psmb10;Psmb2;Psmb3;Psmb4;Psmb5;Psmb6;Psmb7;Psmb8;Psmb9;Psmc1;Psmc2;Psmc4;Psmc5;Psmd1;Psmd11;Psmd12;Psmd13;Psmd2;Psmd3;Psmd4;Psmd6;Psmd7;Psme1;Psme2;Psme3;Psme4;Sem1
3 Fen1;Lig1;Mcm2;Mcm3;Mcm4;Mcm5;Mcm6;Mcm7;Pcna;Pola1;Pold1;Pold2;Pole2;Pole3;Pole4;Prim1;Prim2;Rfc1;Rfc2;Rfc3;Rfc4;Rfc5;Rnaseh2a;Rnaseh2b;Rnaseh2c;Rpa1;Rpa2;Rpa3;Ssbp1
4 Acin1;Alyref;Alyref2;Bcas2;Bud31;Ccdc12;Ddx39b;Ddx42;Ddx46;Dhx15;Eftud2;Hnrnpa1;Hnrnpa3;Hnrnpc;Hnrnpk;Hnrnpm;Hnrnpu;Isy1;Lsm2;Lsm3;Lsm4;Lsm5;Lsm6;Lsm7;Lsm8;Magoh;Magohb;Ncbp2;Pcbp1;Phf5a;Plrg1;Ppie;Ppih;Ppil1;Pqbp1;Prpf19;Prpf31;Prpf38a;Prpf40a;Prpf6;Puf60;Rbm17;Rbm22;Rbm25;Rbm8a;Rbmx;Rbmxl1;Sf3a1;Sf3a2;Sf3a3;Sf3b1;Sf3b2;Sf3b3;Sf3b4;Sf3b5;Sf3b6;Snrnp200;Snrnp40;Snrnp70;Snrpa;Snrpa1;Snrpb;Snrpb2;Snrpc;Snrpd1;Snrpd2;Snrpd3;Snrpe;Snrpf;Snrpg;Snu13;Snw1;Srsf1;Srsf2;Srsf3;Srsf6;Srsf7;Srsf9;Thoc2;Thoc3;Tra2a;Tra2b;Txnl4a;U2af1;U2af2;Zmat2
5 Casp3;Casp8;Ccl2;Ccl7;Cebpb;Cxcl1;Cxcl10;Cxcl2;Cxcl5;Elavl1;Fosb;Fosl1;Hsp90aa1;Hsp90b1;Il17rc;Il1b;Jun;Lcn2;Mmp3;Mmp9;Nfkb1;Nfkbia;Ptgs2;S100a8;S100a9;Srsf1;Tnfaip3;Tradd;Traf4;Traf5
6 Apaf1;Atp5a1;Atp5b;Atp5c1;Atp5d;Atp5f1;Atp5g1;Atp5g2;Atp5g3;Atp5h;Atp5j;Atp5o;Casp3;Cox4i1;Cox5a;Cox5b;Cox6a1;Cox6b1;Cox7a2;Cox7b;Cox8a;Cyc1;Cycs;Gnai2;Ndufa10;Ndufa12;Ndufa3;Ndufa4;Ndufa5;Ndufa7;Ndufa8;Ndufa9;Ndufab1;Ndufb10;Ndufb11;Ndufb5;Ndufb6;Ndufb7;Ndufb8;Ndufb9;Ndufc1;Ndufc2;Ndufs2;Ndufs3;Ndufs4;Ndufs5;Ndufs6;Ndufs7;Ndufs8;Ndufv1;Ndufv2;Park7;Ppif;Prkaca;Sdhb;Sdhc;Sdhd;Slc25a4;Slc25a5;Uba1;Ubb;Ube2j2;Ube2l3;Uqcr10;Uqcr11;Uqcrb;Uqcrc1;Uqcrc2;Uqcrfs1;Uqcrq;Vdac1;Vdac2;Vdac3The columns of the GSEA results are quite similar to the ORA results, with the following exceptions:
enrichmentScore: reflects the degree to which a gene-set is over-represented at the extremes of a ranked list of genes.normalizedEnrichmentScore: corrects for differences in ES between gene-sets due to differences in gene-set sizes to make the scores of the tested gene-sets comparable with each other by dividing the enrichment score (ES) by the mean of all ESs from all random permutationsleadingEdgeNum: is the subset of members that contribute most to the ES; e.g. number of genes preceding the peak score for positive enrichments.
Additionally, for each pathway with FDR < fdrThr, a
GSEA enrichment plot is automatically generated. The following is an
example for the ECM enrichment:

At the bottom, we can see the fold-change rankings of the query genes from our comparison. In the middle are the marks indicating which genes in the ranking are annotated for that pathway. At the top is the enrichment score progression, with a dotted line at the max score position.
GSEA for Day 7 vs Day 0
We’ll repeat the process for our Day 7 vs Day 0 comparison in pericytes.
# -------------------------------------------------------------------------
# Load pseudo-bulk analysis for D7 vs D7 in pericyte cluster
isc_d7_v_d0 = read_csv('inputs/single_cell_de_results/de_pseudo_pericyte_D7_vs_D0.csv')
Rows: 22974 Columns: 6
── Column specification ──────────────────────────────────────────────────────────────────────────
Delimiter: ","
chr (1): gene
dbl (5): p_val, avg_log2FC, pct.1, pct.2, p_val_adj
ℹ Use `spec()` to retrieve the full column specification for this data.
ℹ Specify the column types or set `show_col_types = FALSE` to quiet this message.# -------------------------------------------------------------------------
# Preview the result
head(isc_d7_v_d0)# A tibble: 6 × 6
p_val avg_log2FC pct.1 pct.2 p_val_adj gene
<dbl> <dbl> <dbl> <dbl> <dbl> <chr>
1 3.98e-227 -5.49 1 1 1.05e-222 Cilp2
2 6.29e-121 -3.78 1 1 1.67e-116 Tsc22d3
3 7.24e-121 -2.71 1 1 1.92e-116 Thbs4
4 2.26e-119 -2.30 1 1 5.97e-115 Insc
5 2.66e-118 -3.38 1 1 7.06e-114 Cst3
6 3.92e-110 -3.72 1 1 1.04e-105 Ckb # -------------------------------------------------------------------------
# Select gene and avg_log2FC columns
isc_d7_v_d0_gsea = isc_d7_v_d0 %>%
dplyr::select(gene, avg_log2FC)
# -------------------------------------------------------------------------
# Preview the table
head(isc_d7_v_d0_gsea)# A tibble: 6 × 2
gene avg_log2FC
<chr> <dbl>
1 Cilp2 -5.49
2 Tsc22d3 -3.78
3 Thbs4 -2.71
4 Insc -2.30
5 Cst3 -3.38
6 Ckb -3.72# -------------------------------------------------------------------------
# Run GSEA
isc_d7_v_d0_gsea_result = WebGestaltR(
enrichMethod = 'GSEA',
nThreads = 8,
organism = 'mmusculus',
enrichDatabase = c('pathway_KEGG'),
interestGene = isc_d7_v_d0_gsea,
interestGeneType = 'genesymbol',
fdrThr = 0.1,
outputDirectory = './results',
projectName = 'D7_v_D0_GSEA_KEGG',
cache = NULL)Loading the functional categories...
Loading the ID list...Warning in dir.create(projectDir): './results/Project_D7_v_D0_GSEA_KEGG' already existsSummarizing the uploaded ID list by GO Slim data...Performing the enrichment analysis...Warning in swGsea(inputDf, thresh_type = "val", perms = perNum, min_set_size = minNum, : score does not contain minimum number of items in set for mmu00072Warning in swGsea(inputDf, thresh_type = "val", perms = perNum, min_set_size = minNum, : score does not contain minimum number of items in set for mmu00130Warning in swGsea(inputDf, thresh_type = "val", perms = perNum, min_set_size = minNum, : score does not contain minimum number of items in set for mmu00232Warning in swGsea(inputDf, thresh_type = "val", perms = perNum, min_set_size = minNum, : score does not contain minimum number of items in set for mmu00290Warning in swGsea(inputDf, thresh_type = "val", perms = perNum, min_set_size = minNum, : score does not contain minimum number of items in set for mmu00400Warning in swGsea(inputDf, thresh_type = "val", perms = perNum, min_set_size = minNum, : score does not contain minimum number of items in set for mmu00440Warning in swGsea(inputDf, thresh_type = "val", perms = perNum, min_set_size = minNum, : score does not contain minimum number of items in set for mmu00471Warning in swGsea(inputDf, thresh_type = "val", perms = perNum, min_set_size = minNum, : score does not contain minimum number of items in set for mmu00472Warning in swGsea(inputDf, thresh_type = "val", perms = perNum, min_set_size = minNum, : score does not contain minimum number of items in set for mmu00524Warning in swGsea(inputDf, thresh_type = "val", perms = perNum, min_set_size = minNum, : score does not contain minimum number of items in set for mmu00740Warning in swGsea(inputDf, thresh_type = "val", perms = perNum, min_set_size = minNum, : score does not contain minimum number of items in set for mmu00750Warning in swGsea(inputDf, thresh_type = "val", perms = perNum, min_set_size = minNum, : score does not contain minimum number of items in set for mmu00780Warning in swGsea(inputDf, thresh_type = "val", perms = perNum, min_set_size = minNum, : score does not contain minimum number of items in set for mmu00785Warning in swGsea(inputDf, thresh_type = "val", perms = perNum, min_set_size = minNum, : score does not contain minimum number of items in set for mmu00920Warning in swGsea(inputDf, thresh_type = "val", perms = perNum, min_set_size = minNum, : score does not contain minimum number of items in set for mmu04122Warning in swGsea(inputDf, thresh_type = "val", perms = perNum, min_set_size = minNum, : score has more than 500 items in set mmu011001000 permutations of score complete...Begin affinity propagation...
End affinity propagation...
Begin weighted set cover...
End weighted set cover...
Generate the final report...
Results can be found in the ./results/Project_D7_v_D0_GSEA_KEGG!# clean up session
gc() used (Mb) gc trigger (Mb) limit (Mb) max used (Mb)
Ncells 5027298 268.5 9336260 498.7 NA 9336260 498.7
Vcells 10001275 76.4 111478140 850.6 36864 139347541 1063.2# -------------------------------------------------------------------------
# View the results for the other timepoint
head(isc_d7_v_d0_gsea_result) geneSet description
1 mmu03010 Ribosome
2 mmu03030 DNA replication
3 mmu05134 Legionellosis
4 mmu05143 African trypanosomiasis
5 mmu05012 Parkinson disease
6 mmu00190 Oxidative phosphorylation
link
1 http://www.kegg.jp/kegg-bin/show_pathway?mmu03010+68028+19951+11837+20084+19896+27367+16785+20085+27050+66242+67945+16898+66480+19942+27207+67427+19944+20103+76808+68193+67115+270106+107734+94065+267019+76846+20104+20115+20068+67891+27397+22121+20116+19899+20091+19943+269261+26451+20044+66489+27370+20042+67941+56040+20055+19921+19988+78294+67025+68172+114641+20088+66483+68463+66475+68436+56282+68052+19981+54217+22186+68735+68611+64657+67248+54127+19934+19989+20102+100503670+67097+100043813+94063+26961+19941+14109+27398+67671+319195+107732+216767+66845+65019+19933+66407+67281+67186+19982+20005+118451+268449+20054+27176+67707+68537+66419+69527
2 http://www.kegg.jp/kegg-bin/show_pathway?mmu03030+66979+17215+68240+59001+19718+17219+67153+17216+69263+19891+18538+19076+14156+72151+16881+17218+17217+19687+18973+106344+18972+19075
3 http://www.kegg.jp/kegg-bin/show_pathway?mmu05134+14825+20310+18035+193740+67160+15511+16176+12367+12176+20224+16173+11783+94044+17874+66397+18033+16193+56422+76308+12475+13627+12369+11840+330122+269523+66824+12371+12362+13063+15510
4 http://www.kegg.jp/kegg-bin/show_pathway?mmu05143+15122+100503605+110257+18795+101488143+22329+18752+16176+16775+16173+18797
5 http://www.kegg.jp/kegg-bin/show_pathway?mmu05012+28080+12861+11740+11951+67942+12859+12367+22272+22195+66142+66916+22273+110323+66046+11739+67264+66925+66694+17992+12858+68197+66594+12867+67126+22333+68375+11946+11783+12864+64704+12857+67273+66218+70316+66416+11949+67680+66043+66377+66091+66576+66052+66414+140499+56791+66495+66108+57320+17991+407785+12868+14678+595136+22201+18749+11950+228033+104130+226646+67128+225887+105675+14679+66152+12371+13063+11947+66445+71679+20463+333182
6 http://www.kegg.jp/kegg-bin/show_pathway?mmu00190+28080+12861+11951+67942+12859+67895+22272+66142+66916+22273+110323+66046+67264+66925+66694+17992+12858+68197+66594+11966+12867+67126+68375+11946+12864+66144+57423+12857+74776+67273+66218+70316+11973+66416+11949+76429+67680+11972+66043+66377+66091+70383+66576+11974+27425+66052+66414+12856+66495+66108+17991+407785+12868+595136+11950+228033+104130+226646+225887+66152+11947+66445+71679+20463+333182
enrichmentScore normalizedEnrichmentScore pValue FDR size
1 0.7912312 2.417427 0 0.000000000 129
2 0.7655349 1.897692 0 0.004232919 35
3 0.6762411 1.806759 0 0.013706595 56
4 0.7320667 1.781105 0 0.015419920 33
5 0.5633096 1.730064 0 0.020387120 125
6 0.5723894 1.735549 0 0.021567731 115
plotPath leadingEdgeNum
1 ./Project_D7_v_D0_GSEA_KEGG_GSEA/mmu03010.png 97
2 ./Project_D7_v_D0_GSEA_KEGG_GSEA/mmu03030.png 22
3 ./Project_D7_v_D0_GSEA_KEGG_GSEA/mmu05134.png 30
4 ./Project_D7_v_D0_GSEA_KEGG_GSEA/mmu05143.png 11
5 ./Project_D7_v_D0_GSEA_KEGG_GSEA/mmu05012.png 71
6 ./Project_D7_v_D0_GSEA_KEGG_GSEA/mmu00190.png 65
leadingEdgeId
1 68028;19951;11837;20084;19896;27367;16785;20085;27050;66242;67945;16898;66480;19942;27207;67427;19944;20103;76808;68193;67115;270106;107734;94065;267019;76846;20104;20115;20068;67891;27397;22121;20116;19899;20091;19943;269261;26451;20044;66489;27370;20042;67941;56040;20055;19921;19988;78294;67025;68172;114641;20088;66483;68463;66475;68436;56282;68052;19981;54217;22186;68735;68611;64657;67248;54127;19934;19989;20102;100503670;67097;100043813;94063;26961;19941;14109;27398;67671;319195;107732;216767;66845;65019;19933;66407;67281;67186;19982;20005;118451;268449;20054;27176;67707;68537;66419;69527
2 66979;17215;68240;59001;19718;17219;67153;17216;69263;19891;18538;19076;14156;72151;16881;17218;17217;19687;18973;106344;18972;19075
3 14825;20310;18035;193740;67160;15511;16176;12367;12176;20224;16173;11783;94044;17874;66397;18033;16193;56422;76308;12475;13627;12369;11840;330122;269523;66824;12371;12362;13063;15510
4 15122;100503605;110257;18795;101488143;22329;18752;16176;16775;16173;18797
5 28080;12861;11740;11951;67942;12859;12367;22272;22195;66142;66916;22273;110323;66046;11739;67264;66925;66694;17992;12858;68197;66594;12867;67126;22333;68375;11946;11783;12864;64704;12857;67273;66218;70316;66416;11949;67680;66043;66377;66091;66576;66052;66414;140499;56791;66495;66108;57320;17991;407785;12868;14678;595136;22201;18749;11950;228033;104130;226646;67128;225887;105675;14679;66152;12371;13063;11947;66445;71679;20463;333182
6 28080;12861;11951;67942;12859;67895;22272;66142;66916;22273;110323;66046;67264;66925;66694;17992;12858;68197;66594;11966;12867;67126;68375;11946;12864;66144;57423;12857;74776;67273;66218;70316;11973;66416;11949;76429;67680;11972;66043;66377;66091;70383;66576;11974;27425;66052;66414;12856;66495;66108;17991;407785;12868;595136;11950;228033;104130;226646;225887;66152;11947;66445;71679;20463;333182
userId
1 Fau;Mrpl10;Mrpl11;Mrpl12;Mrpl13;Mrpl14;Mrpl16;Mrpl17;Mrpl2;Mrpl22;Mrpl24;Mrpl28;Mrpl30;Mrpl33;Mrpl34;Mrps10;Mrps15;Mrps16;Mrps18c;Mrps2;Mrps9;Rpl10a;Rpl11;Rpl12;Rpl13;Rpl13a;Rpl14;Rpl15;Rpl17;Rpl18;Rpl18a;Rpl19;Rpl21;Rpl22;Rpl22l1;Rpl23;Rpl23a;Rpl24;Rpl26;Rpl27;Rpl27a;Rpl28;Rpl29;Rpl3;Rpl31;Rpl32;Rpl34;Rpl35;Rpl36;Rpl36a;Rpl36al;Rpl37;Rpl37a;Rpl38;Rpl39;Rpl39l;Rpl4;Rpl41;Rpl5;Rpl6;Rpl7;Rpl7a;Rpl8;Rpl9;Rplp0;Rplp1;Rplp2;Rps10;Rps11;Rps12;Rps13;Rps14;Rps15;Rps15a;Rps16;Rps17;Rps18;Rps19;Rps2;Rps20;Rps23;Rps24;Rps26;Rps27a;Rps27l;Rps27rt;Rps28;Rps3;Rps3a1;Rps4x;Rps5;Rps6;Rps7;Rps8;Rps9;Rpsa;Uba52
2 Fen1;Lig1;Mcm2;Mcm3;Mcm4;Mcm5;Mcm6;Pcna;Pold2;Pole;Pole3;Pole4;Prim1;Prim2;Rfc1;Rfc2;Rfc3;Rfc4;Rfc5;Rnaseh2b;Rpa2;Rpa3
3 Apaf1;Arf1;Bcl2l13;Bnip3;Casp1;Casp3;Casp7;Casp9;Cd14;Cxcl1;Cxcl2;Cxcl3;Cycs;Eef1a1;Eef1g;Hbs1l;Hspa1a;Hspa1b;Hspd1;Il18;Il1b;Il6;Myd88;Nfkb1;Nfkbia;Pycard;Rab1b;Sar1a;Sar1b;Vcp
4 Hba-a1;Hba-a2;Hbb-bs;Hbb-bt;Il18;Il1b;Lama4;Plcb1;Plcb3;Prkcg;Vcam1
5 Apaf1;Atp5a1;Atp5b;Atp5c1;Atp5d;Atp5e;Atp5f1;Atp5g1;Atp5g2;Atp5g3;Atp5h;Atp5o;Casp3;Casp9;Cox4i1;Cox5a;Cox5b;Cox6a1;Cox6b1;Cox6b2;Cox6c;Cox7a2l;Cox7b;Cox7c;Cox8a;Cyc1;Cycs;Gnai2;Gnai3;Htra2;Ndufa10;Ndufa12;Ndufa2;Ndufa3;Ndufa4;Ndufa7;Ndufa8;Ndufa9;Ndufab1;Ndufb11;Ndufb3;Ndufb5;Ndufb7;Ndufb8;Ndufb9;Ndufc1;Ndufc2;Ndufs2;Ndufs5;Ndufs6;Ndufs8;Park7;Ppif;Prkacb;Sdhb;Sdhc;Sdhd;Slc25a4;Slc25a5;Uba1;Ube2g1;Ube2j2;Ube2l3;Ube2l6;Uqcr10;Uqcr11;Uqcrc1;Uqcrfs1;Uqcrh;Uqcrq;Vdac1
6 Atp5a1;Atp5b;Atp5c1;Atp5d;Atp5e;Atp5f1;Atp5g1;Atp5g2;Atp5g3;Atp5h;Atp5j2;Atp5l;Atp5o;Atp6v0d1;Atp6v0e;Atp6v1b2;Atp6v1e1;Atp6v1f;Cox10;Cox17;Cox4i1;Cox5a;Cox5b;Cox6a1;Cox6b1;Cox6b2;Cox6c;Cox7a2l;Cox7b;Cox7c;Cox8a;Cyc1;Lhpp;Ndufa10;Ndufa12;Ndufa2;Ndufa3;Ndufa4;Ndufa7;Ndufa8;Ndufa9;Ndufab1;Ndufb11;Ndufb3;Ndufb5;Ndufb7;Ndufb8;Ndufb9;Ndufc1;Ndufc2;Ndufs2;Ndufs5;Ndufs6;Ndufs8;Ppa1;Ppa2;Sdhb;Sdhc;Sdhd;Uqcr10;Uqcr11;Uqcrc1;Uqcrfs1;Uqcrh;UqcrqHere we see positive enrichment scores
Comparing enrichment results
Now that we have two GSEA results from related differential expression results, we may want to know:
- What pathways are shared versus unique between the timepoints?
- Are there any insights we can glean by comparing pathways at one time point versus another?
We’ll use some of the advanced visualizations from yesterday to answer some of these questions.
Summary
- GSEA is a functional enrichment choice that does not require using thresholds to define genes of interest
- KEGG pathways offers an alternative knowledge base that can be useful for interpretation
Questions
| Previous lesson | Top of this lesson | Next lesson |
|---|